Data Chart
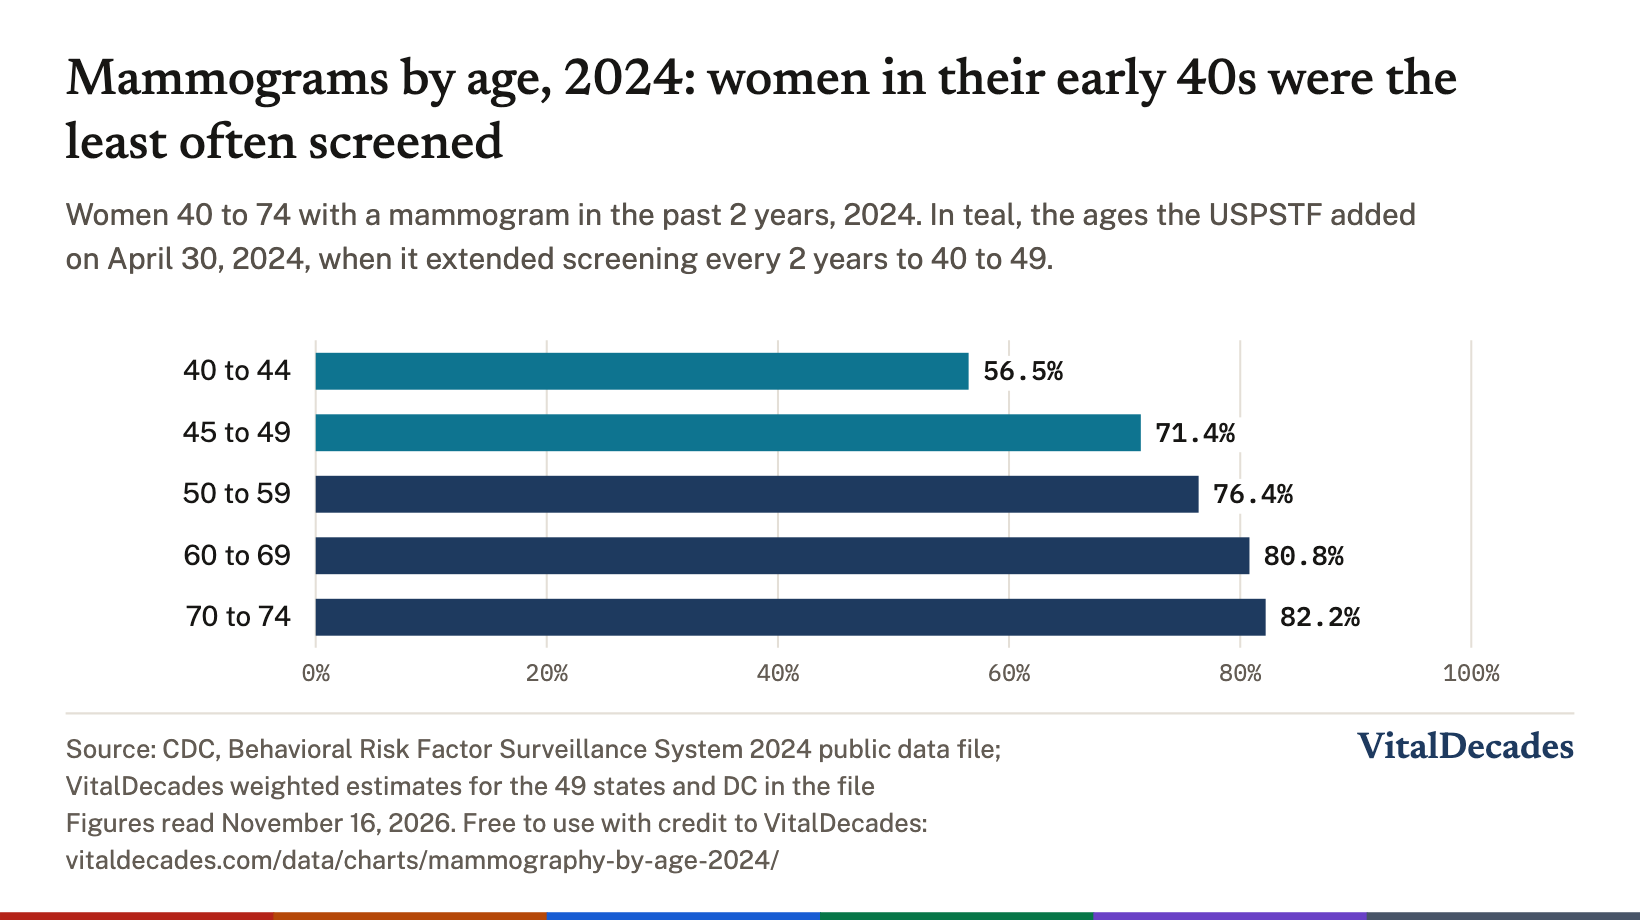
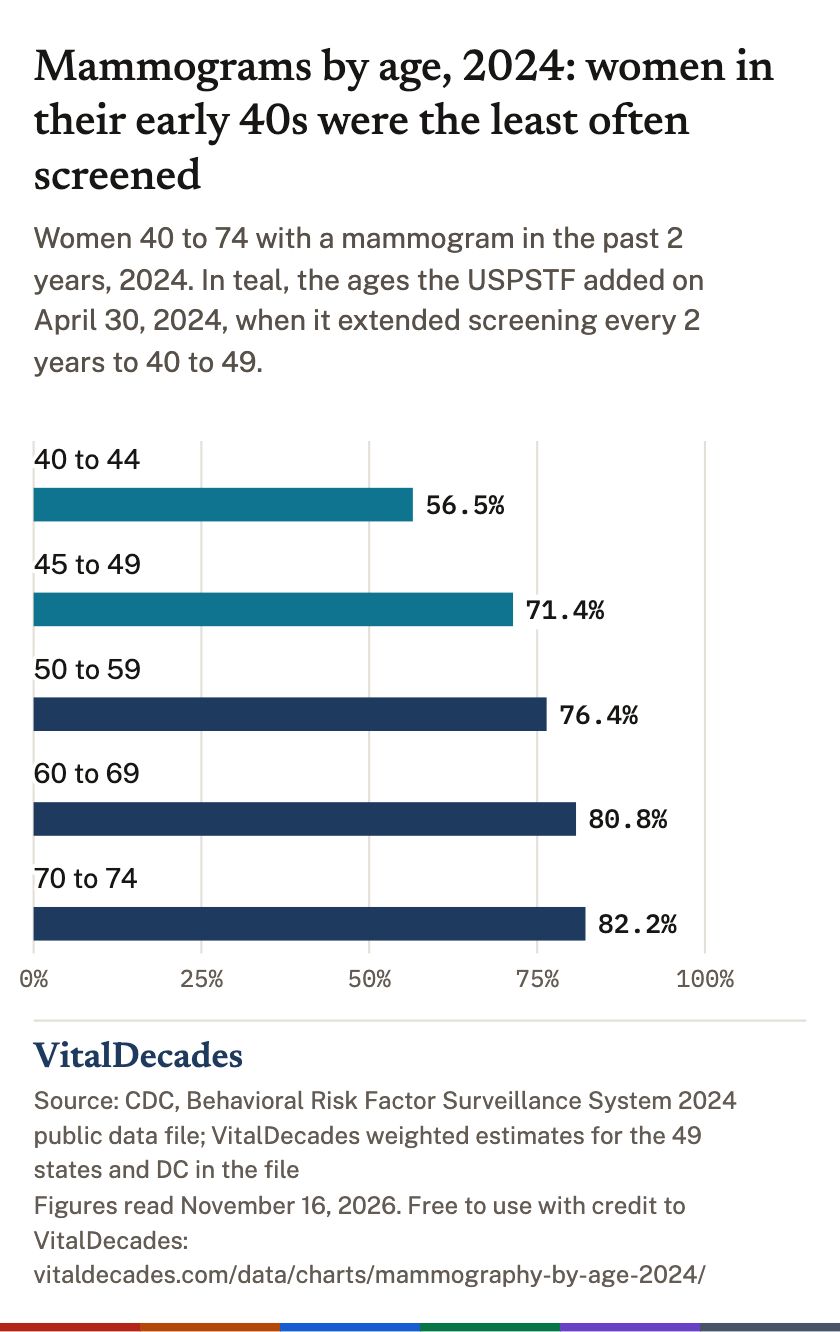
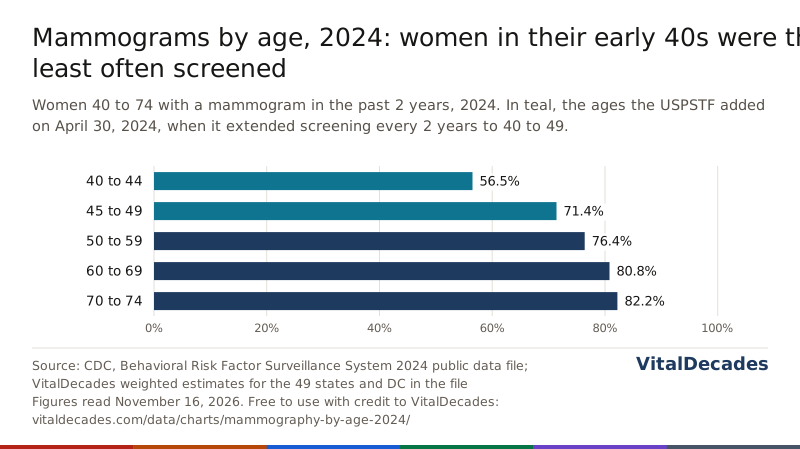
Mammograms by age, 2024: women in their early 40s were the least often screened
Women 40 to 74 with a mammogram in the past 2 years, 2024. In teal, the ages the USPSTF added on April 30, 2024, when it extended screening every 2 years to 40 to 49.
Figures read from 2024 survey data. From Preventive screening statistics: the newest CDC data (2024). Free to use with credit.
What the chart shows
- 56.5% of women 40 to 44 had a mammogram in the past 2 years, against 82.2% at 70 to 74. (CDC BRFSS 2024)
- The USPSTF's April 30, 2024 recommendation: biennial screening mammography for women aged 40 to 74 years (grade B). (USPSTF)
- BRFSS interviews run month by month through the year, so the 2024 answers straddle the April 30 recommendation: the 40s were newly included for only part of the year. (CDC BRFSS 2024 overview)
The numbers
| Age | Percent | CI low 95% | CI high 95% | Unweighted n |
|---|---|---|---|---|
| 40 to 44 | 56.5 | 54.8 | 58.2 | 14714 |
| 45 to 49 | 71.4 | 69.6 | 73.1 | 14284 |
| 50 to 59 | 76.4 | 75.3 | 77.5 | 34212 |
| 60 to 69 | 80.8 | 80.0 | 81.6 | 44920 |
| 70 to 74 | 82.2 | 81.0 | 83.3 | 23242 |
The same rows as a file: numbers in this chart (CSV). The full data, with every source URL: every rate by age, sex, coverage, income, race and ethnicity (CSV).
How we made it
We downloaded CDC's 2024 BRFSS public data file (LLCP2024) and estimated each share with the survey's final weight (_LLCPWT), its strata (_STSTR) and its primary sampling units (_PSU), as CDC's weighting guide instructs. Confidence intervals are 95% Wald intervals from Taylor-series variance. National figures pool the 49 states and DC in the file; Tennessee did not meet CDC's minimum for 2024 and the territories are left out.
To check the method, we recomputed every state's figure for colorectal, breast and lung screening and compared it with CDC's own published 2024 estimate: all 50 point estimates matched to the first decimal (our intervals treat each group as a domain of the full sample and differ from CDC's by at most 0.6 points). Shares resting on fewer than 50 answers, or with a relative standard error over 30%, are suppressed. People who answered "don't know" or refused are left out of that question's denominator.
What it does not show
- BRFSS is a telephone survey of adults not living in institutions, and screening is self-reported; nobody checked the answers against medical records.
- The survey asks about tests, not reasons. A colonoscopy done to check a symptom counts the same as one done to screen.
- The measure asks about a mammogram in the past 2 years. A woman who turned 40 in 2023 or 2024 has had less than 2 years in which to be screened, so the 40 to 44 share is low partly by construction, not only by choice.
- The every-2-years recommendation from 40 dates from April 30, 2024, partway through the survey year; the earlier statement left screening in the 40s to an individual decision. A 2024 figure cannot show the change's full effect.
Sources
- CDC, BRFSS 2024 Survey Data and Documentation
- CDC, Calculated Variables in the 2024 BRFSS Data File
- CDC, BRFSS Prevalence Data (2011 to present), used to check our estimates
The full story behind these numbers, with what to do about them: Preventive screening statistics: the newest CDC data (2024).
More charts like this
By Jennifer Walsh, Preventive Health. Researched and drafted with AI assistance, then edited by the editor named here. Fact-checked by Sarah Whitcomb, Senior Health Editor, . Every figure names the source it was read from and the date it was read. No licensed clinician has reviewed this page. How we verify. Report an error.
Use this chart
Free to use with credit, including in commercial work. Credit VitalDecades and link to this page. Reuse terms
Embed
Paste this into your page's HTML (in WordPress, a Custom HTML block). The chart carries its own source and date and switches to a phone layout in narrow columns; for a column under 560 pixels wide, change the height to 605.
<iframe src="https://vitaldecades.com/embed/chart/mammography-by-age-2024/" title="Mammograms by age, 2024: women in their early 40s were the least often screened" width="100%" height="495" style="border:0;max-width:820px" loading="lazy"></iframe>
<p style="font-size:13px">Chart: <a href="https://vitaldecades.com/data/charts/mammography-by-age-2024/" rel="nofollow">VitalDecades</a></p>
Optional: add this line once per page and every VitalDecades frame grows to fit its content. It only resizes our frames and sends nothing.
<script async src="https://vitaldecades.com/static/js/embed-resize.js"></script>
Your site strips iframes? Use the image
<picture>
<source media="(max-width: 559px)" srcset="https://vitaldecades.com/static/charts/mammography-by-age-2024-phone.png">
<img src="https://vitaldecades.com/static/charts/mammography-by-age-2024.png" alt="Bar chart, 2024, women with a mammogram in the past 2 years by age: 40 to 44, 56.5%; 45 to 49, 71.4%; 50 to 59, 76.4%; 60 to 69, 80.8%; 70 to 74, 82.2%." width="800" style="max-width:100%;height:auto">
</picture>
<p style="font-size:13px">Chart: <a href="https://vitaldecades.com/data/charts/mammography-by-age-2024/" rel="nofollow">VitalDecades</a></p>
Cite
- APA
VitalDecades. (2026, November 16). Mammograms by age, 2024: women in their early 40s were the least often screened [Chart and data set]. https://vitaldecades.com/data/charts/mammography-by-age-2024/
- MLA
"Mammograms by Age, 2024: Women in Their Early 40s Were the Least Often Screened." VitalDecades, 16 Nov. 2026, vitaldecades.com/data/charts/mammography-by-age-2024/.
- Plain credit line
Source: VitalDecades, Mammograms by age, 2024: women in their early 40s were the least often screened, figures read November 16, 2026, https://vitaldecades.com/data/charts/mammography-by-age-2024/